Map it

Chart it
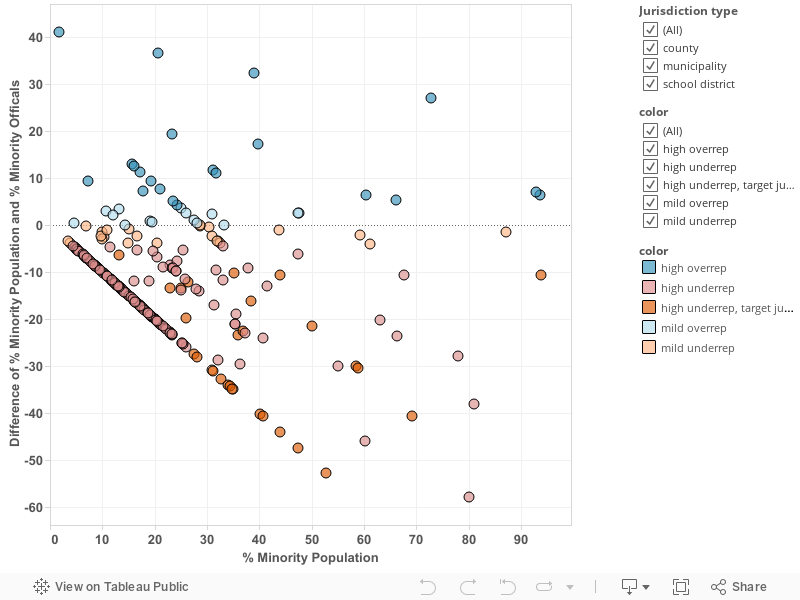
Table it
| Name | Black Citizens of Voting Age (CVAP) | Latino (CVAP) | Asian-American (CVAP) | Elected Officials of Color | Disparity (= combined minority CVAP - % elected officials of color) |
|---|---|---|---|---|---|
| City of Zion | 36.3% | 13.9% | 2.6% | 0% (0 out of 4) | 53% |
| Glendale Heights | 7.3% | 16.9% | 23.2% | 0% (0 out of 6) | 47% |
| Hanover Park | 10.7% | 16.9% | 16.4% | 0% (0 out of 6) | 44% |
| Lansing Village | 31.1% | 8.8% | 0.5% | 0% (0 out of 6) | 40% |
| Carpentersville | 6.9% | 28.7% | 4.6% | 0% (0 out of 6) | 40% |
| Blue Island City | 38.1% | 31.0% | 0.1% | 28.6% (4 out of 14) | 40% |
| Leyden Community High School District 212 | 2.5% | 27.8% | 4.5% | 0% (0 out of 7) | 35% |
| Morton Grove | 1.8% | 4.8% | 27.5% | 0% (0 out of 6) | 34% |
| Fenton Community High School District 100 | 3.0% | 21.9% | 3.2% | 0% (0 out of 7) | 28% |
| DuPage County | 4.6% | 7.4% | 8.7% | 0% (0 out of 18) | 21% |